Mat Zaga

Hi, I'm Mat. After 10+ years of tech leadership that meant shipping complex production algorithms — ad quality at Facebook and, most recently, spy satellites — I went back to maths grad school at Baruch in NYC to get more hands-on and re-tool myself.
I graduate in December 2026 and am looking for an interesting full-time quant role · a role that could benefit from my maths skills and tech leadership background. As you'll see below, I'm a bit of a technical Swiss Army knife and would thrive in a growing team, a growing product or a new pod.
I don't expect you to spend your afternoon digging through my GitHub. Here are the architecture diagrams and write-ups behind my recent technical work, plus a few things a resume has no room for.
Recent technical projects
Before grad school
Skills and technologies
MORE →
About me
 Baruch MFE, CUNY
GPA 3.8+ · EXP. DEC 2026
 LSE
MSc Applied Maths, with merit · 2013
 Erasmus University Rotterdam
Computer science minor · exchange
 Yandex School of Data Analysis
Masters programme · visiting student



Non-work vibe-coding
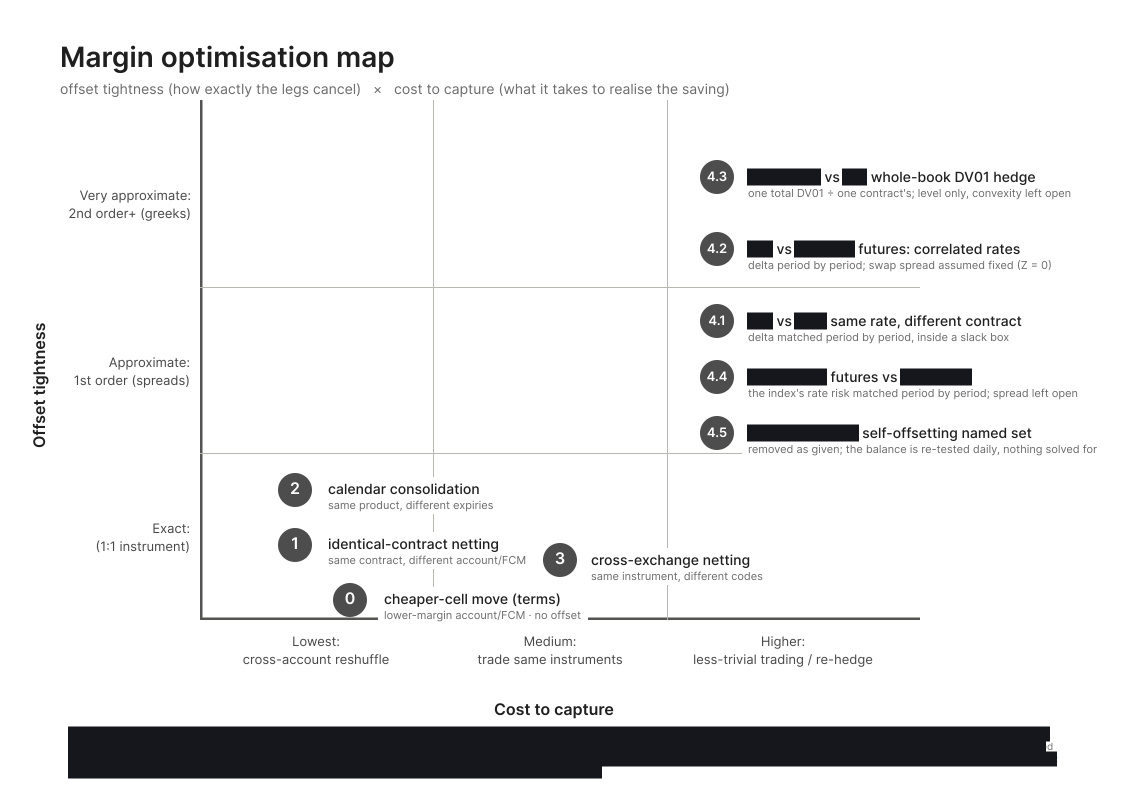
Prop desk margin optimisation
Built the desk's margin-optimisation pipeline end to end: exchange and broker positions in, equivalent-exposure lower-collateral trades out, ranked live on a trader dashboard.
CME and ICE APIs, SPAN and IRM margin methodologies replicated in-house; Python cron engine on headless Linux, Node/JS front end for the desk.
Forecasting 24-hour residual returns
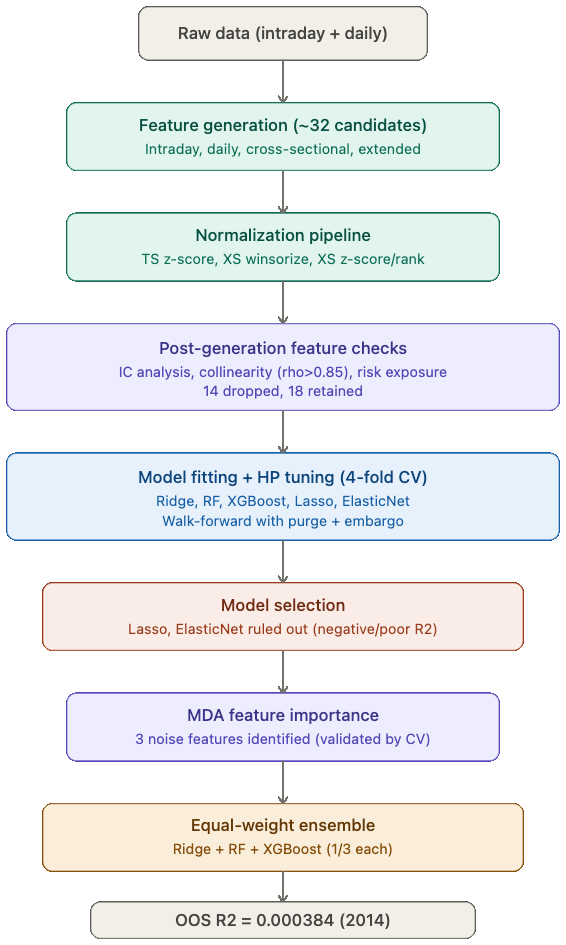
Predicting 24-hour forward residual returns across ~875 US equities, 2010—2014, on 15-minute intraday snapshots and daily OHLCV.
Fairly standard clean pipeline: ~32 candidate features — intraday microstructure, aggregated intraday, daily price-volume, cross-sectional — narrowed to 18 by rank-IC screening, collinearity pruning and risk-exposure checks. Two-stage normalisation: per-stock 20-day rolling z-score, then per-date winsorisation and cross-sectional z-scoring. MDA feature importance was quite informative too.
RF alone performed a bit better OOS, but final submitted model for methodological purity was an ensemble of Ridge, RF and XGBoost; cross-validated weight search converged on simple equal thirds.
The only better result in the comparison group on the same data used 100's features which I didn't pursue to retain some parsimony.
Calibrating a transformer that was sure of itself
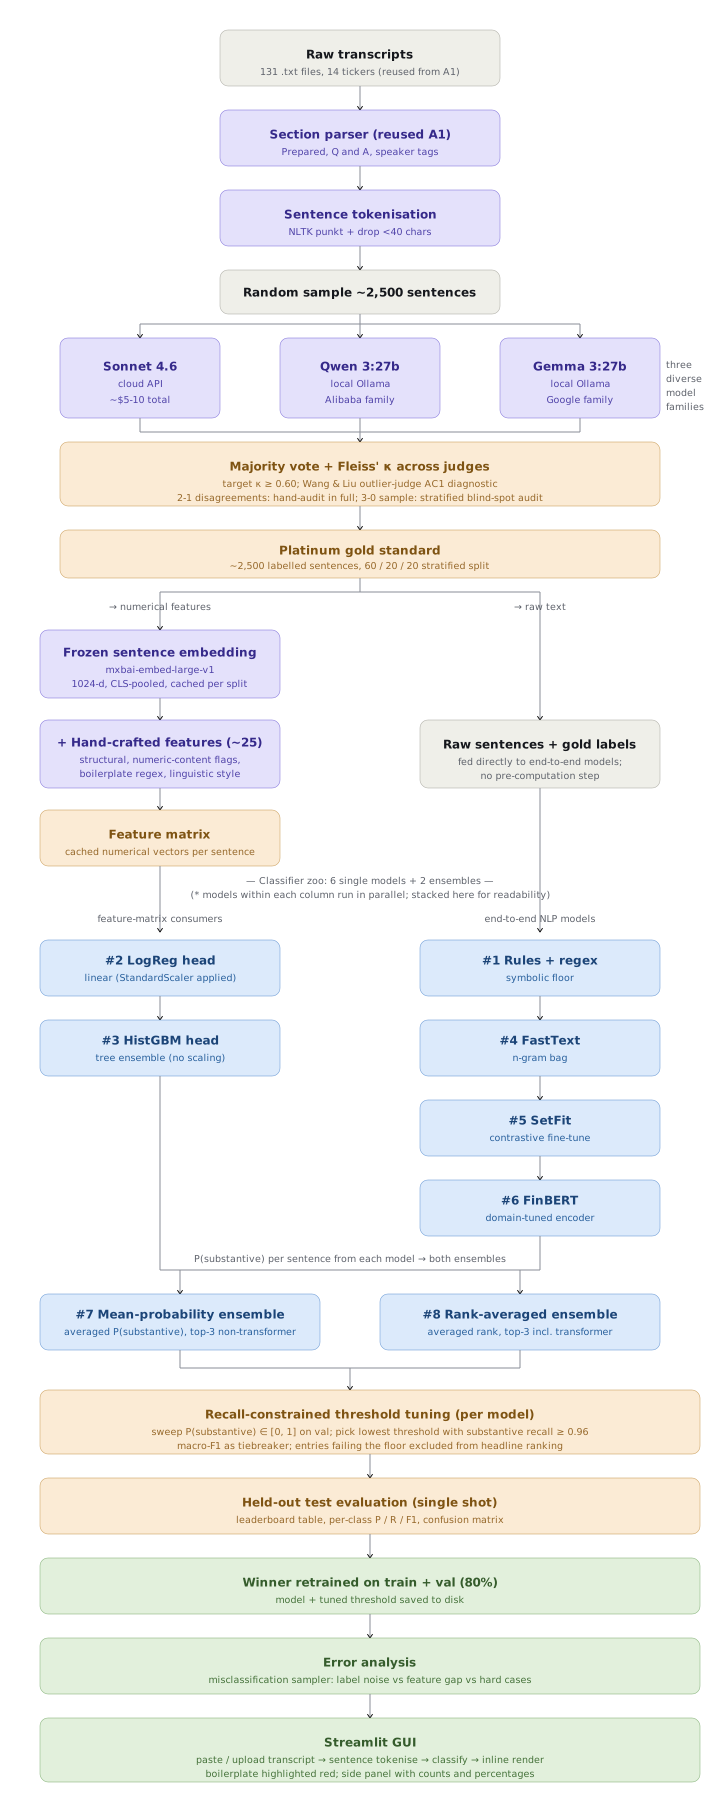
Improved transformer calibration and robustness to overconfidence via label smoothing and temperature scaling for an earnings-call classifier — a SetFit / FinBERT / HistGBM ensemble, tuned under F1 and substantive-recall constraints.
The label set is the foundation: ~2,500 sentences from 131 transcripts judged independently by three model families (Sonnet, Qwen, Gemma), reconciled by majority vote with Fleiss' κ and an outlier-judge diagnostic; 2—1 disagreements hand-audited in full, unanimous calls sampled for blind spots.
Then a classifier zoo — rules, LogReg and HistGBM heads on cached embeddings plus ~25 hand-crafted features, FastText, SetFit, FinBERT, and two ensembles — with thresholds swept per model under a substantive-recall floor, macro-F1 as tiebreaker, and one single-shot held-out evaluation. The winner is retrained on train+val and served in a Streamlit GUI that highlights boilerplate inline.
A top-10 game bot on a tenth of the compute
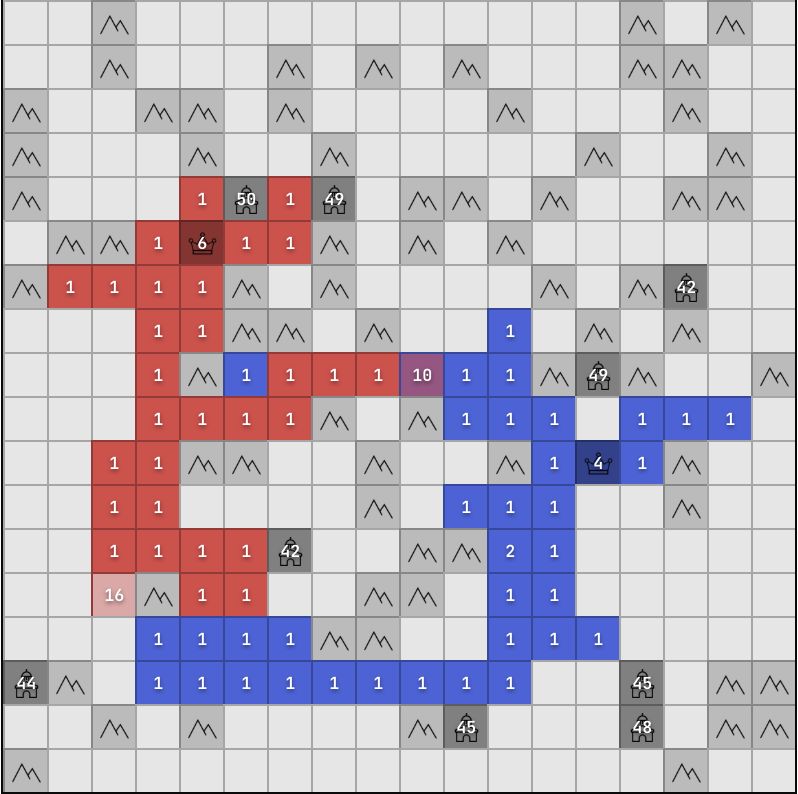
generals.io is a two-player, real-time strategy game where you can't see most of the board. The competition version lets you build castles and gives you 150 ms per move on one CPU core. I started from a published self-play recipe and changed what the network sees, where its games start, how it was pushed to try castles, and how progress was measured.
Below: the training loop, then the improvements. Each letter is an improvement made at that step.
- 38 standard layers: armies, ownership, fog, move history.
- +11 derived layers: five threat maps — how soon an enemy force can reach each cell, how much could arrive, how far your own general is — computed in one pass; countdowns to the turn-800 and turn-1200 rule changes, which the raw turn counter can't resolve in half-precision.
- Castle price per cell, taken from the game's own cost function — the net sees exactly what it will be charged.
- Its own belief fed back: a dedicated head predicts where the hidden enemy general is; last turn's answer is an input this turn, so the network keeps updating a posterior instead of guessing from scratch.
- An early plan had the net predict incoming threat as an output. Threat is computable from the board, so it became an input instead — don't ask a model to guess what you can calculate.
- I watched the bot's games, spotted its recurring mistakes, wrote each as a formal rule, and mined 284k real games for matching moments — about 20,000 positions across six situation types. E.g.: a castle built then lost within 50 turns; a 20-stack two squares from the enemy general but four by path; land grabbed behind you after first contact; the bot's own win-prediction flipping against the actual outcome and never recovering.
- Half of all training games start 10 turns before such a moment. A once-in-a-thousand-games decision becomes one the bot faces hundreds of times, with whichever choice wins more getting reinforced — that is what pushes it to choose differently.
- A fresh agent never builds by default — castles cost a lot of army up front and pay back too slowly for it to discover the value — and a naive per-castle bonus makes it build everywhere.
- So I pushed the model to try the build action more often without over-rewarding it, and let it learn from the outcomes: a small material bonus shaped so it cancels out over a whole game (potential-based shaping, Ng, Harada & Russell 1999) plus a forced build on a fraction of turns.
- The forced tries only fire where formal rules say a castle makes sense: it repays its cost before the turn-1200 cutoff, leaves army behind to hold it, no enemy force can reach it in time, nothing unseen is within 3 squares. Once the network's own urge to build there passes 25%, the push switches itself off.
- The learning rate — how far the weights move per update — should shrink as training matures, down to a settling phase at the very end. I grandfathered the recipe's decay schedule, written for one continuous run, without re-basing it when resuming across legs.
- By the last leg the rate had decayed ~4× below where a still-learning net wants it, while total training volume sat at ~10% of the top competitors'. Small steps on a small budget read as a plateau. The fix is two lines: reset the clock at each resume.
- No access to the judges' machine, so latency was measured single-core on a laptop and calibrated against the live bot (×2.2 overhead factor). The 7M network takes ~7 ms a move, the 11M one ~10 ms.
- A harness around the network adds ~2 ms: two-view ensembling (board + its rotation), sampling among near-tied moves, a loop-breaker, a mate-in-one check, a doomed-castle veto — worth an estimated +10–20 rating points.
- The obvious use for the remaining ~130 ms is search: a 2-ply lookahead over the top 8 moves would fit. It needs a value head precise enough to rank sibling moves; mine was improving but, with the D mistake and the budget, never got there.
- Every snapshot plays a fixed roster of opponents — earlier snapshots plus outside reference bots — each map twice with sides swapped so luck cancels. Games go to members the bot still loses to; anyone beaten past 85% is retired, because beyond that a win rate carries no information.
- Ship decisions use a sequential test that stops as soon as the evidence is decisive — one release cleared in 14 games.
- All ~30,000 test games ran on a laptop, not the rented GPU, on a batched runner 66× faster than the reference one. Testing had been eating 19% of every paid GPU second.
- Self-play, where “self” is half a mirror of the current network and half a pool of 15 frozen past versions, drawn in proportion to how often they still win; anything beaten >90% gets zero games.
- I logged which opponents were actually drawn and found the weighting running backwards — favouring the already-beaten — for the first 1,700 steps. Fixed on the spot.
- The game's rules changed mid-corpus: 200k games under the new rules, 212k under the old. Filtering to strong, current games would have discarded ~80%. Instead, each game's player skill and rule version were fed to the network as inputs, so it learns “this is how a 2,400-rated player behaves under the old rules”.
- The test was fixed in advance: a model trained on the full messy corpus had to match one trained on hand-curated data. It did, within the noise. Every position was also used in all 8 board symmetries, and train/test were split by map rather than by game, so a map seen in training could never appear in testing.
- Goal: a bigger network that starts exactly as strong as the 7M one. Training a fresh 11M network to imitate the 7M one failed — after 48k steps the copy still lost 98% of games to the original.
- Instead, Net2Net-style growth (Chen, Goodfellow & Shlens, 2016): copy every existing weight into a deeper network and insert four new layers initialised to output zero. Day one it plays identically to the original — 49% head-to-head, untrained — and the new layers can only add. Depth over width per Straka & Schmid 2026.
- ~$41 of GPU behind the shipped version, against $1,000+ for the 3rd-place bot. Rule: paid GPUs only ever train.
- Everything else offloaded: all 30k test games to a laptop (19% of paid seconds reclaimed); the 11M distillation — a job with no rating gain by design — to free Colab A100 credits; vast.ai instead of RunPod at 1.63× less per training step.
- Watchdogs with balance floors that stop the box automatically, but only after a checksummed copy of the checkpoint is confirmed in the cloud.
- Imitation copies of the top ladder bots, trained on their public games, as measurement anchors — admitted only if they scored 30–70% against my bot. One passed; the rest were data-starved.
- Exploiter bots trained to beat my champion: four attempts, all collapsed within ~100 steps. Diagnosed after: each had been started from the champion's own weights.
- Search at inference: gated on value-head precision; never opened (see E).
- Seven extra harness rules over ~20k paired games: none beat the shipped set once replicated on fresh maps.
- Masking the “pass” move (the bot passed 5% of turns vs 1.4% for elite players): −25 rating points. Left unmasked.
Continuous calorie counter
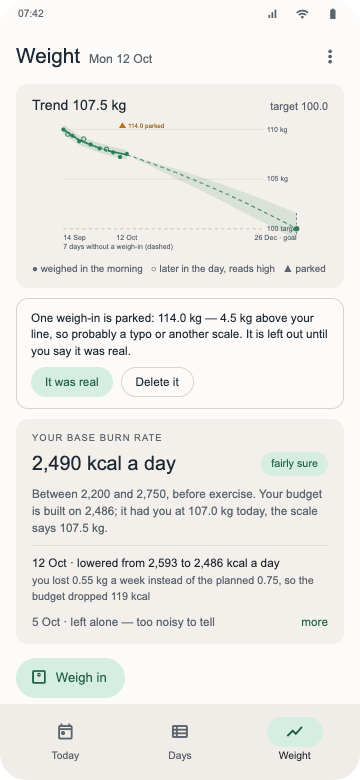
Granted, there is a lot of calorie-tracking apps. There are quite few that scientifically marry your recorded calorie deficit with the actual weight dynamics — this one does, updating the base burn rate assumption through Kalman filtering.
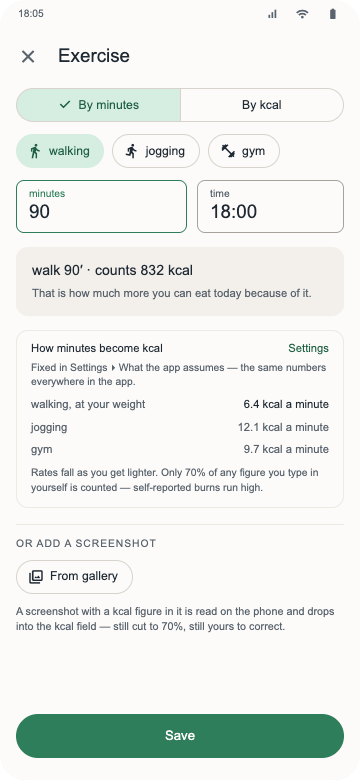
It also lets you use AI for input more tightly: share an LLM's reply, drop a screenshot of one, query Claude directly, or just type the meal in.
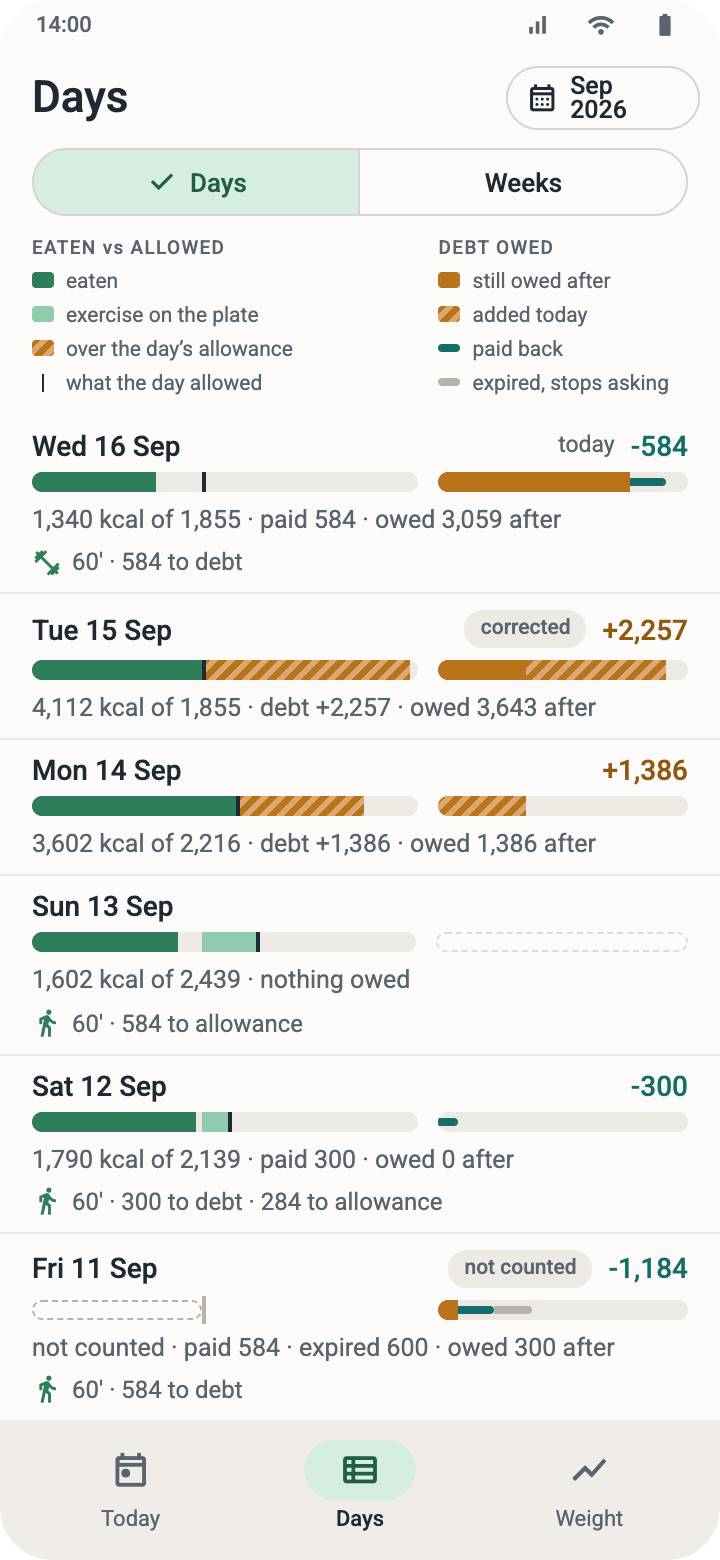
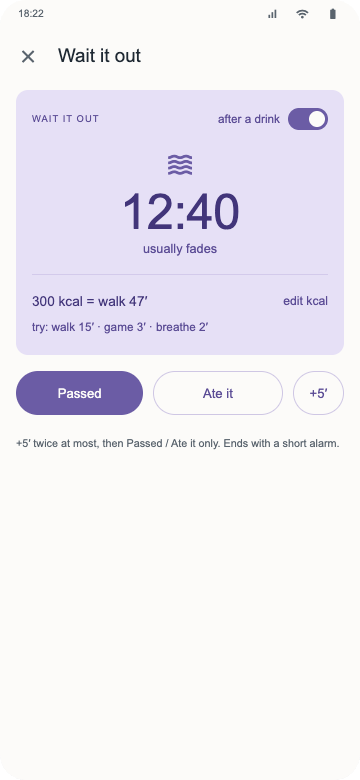
And just like with your real body, a deficit or surplus doesn't magically disappear overnight — it carries, and you get a specific estimate of how much you need to work out to get back on track.



Sublet finder
I move around a lot, and two years of grad school made Airbnb and Booking prices feel like far too much for short- to mid-term stays.
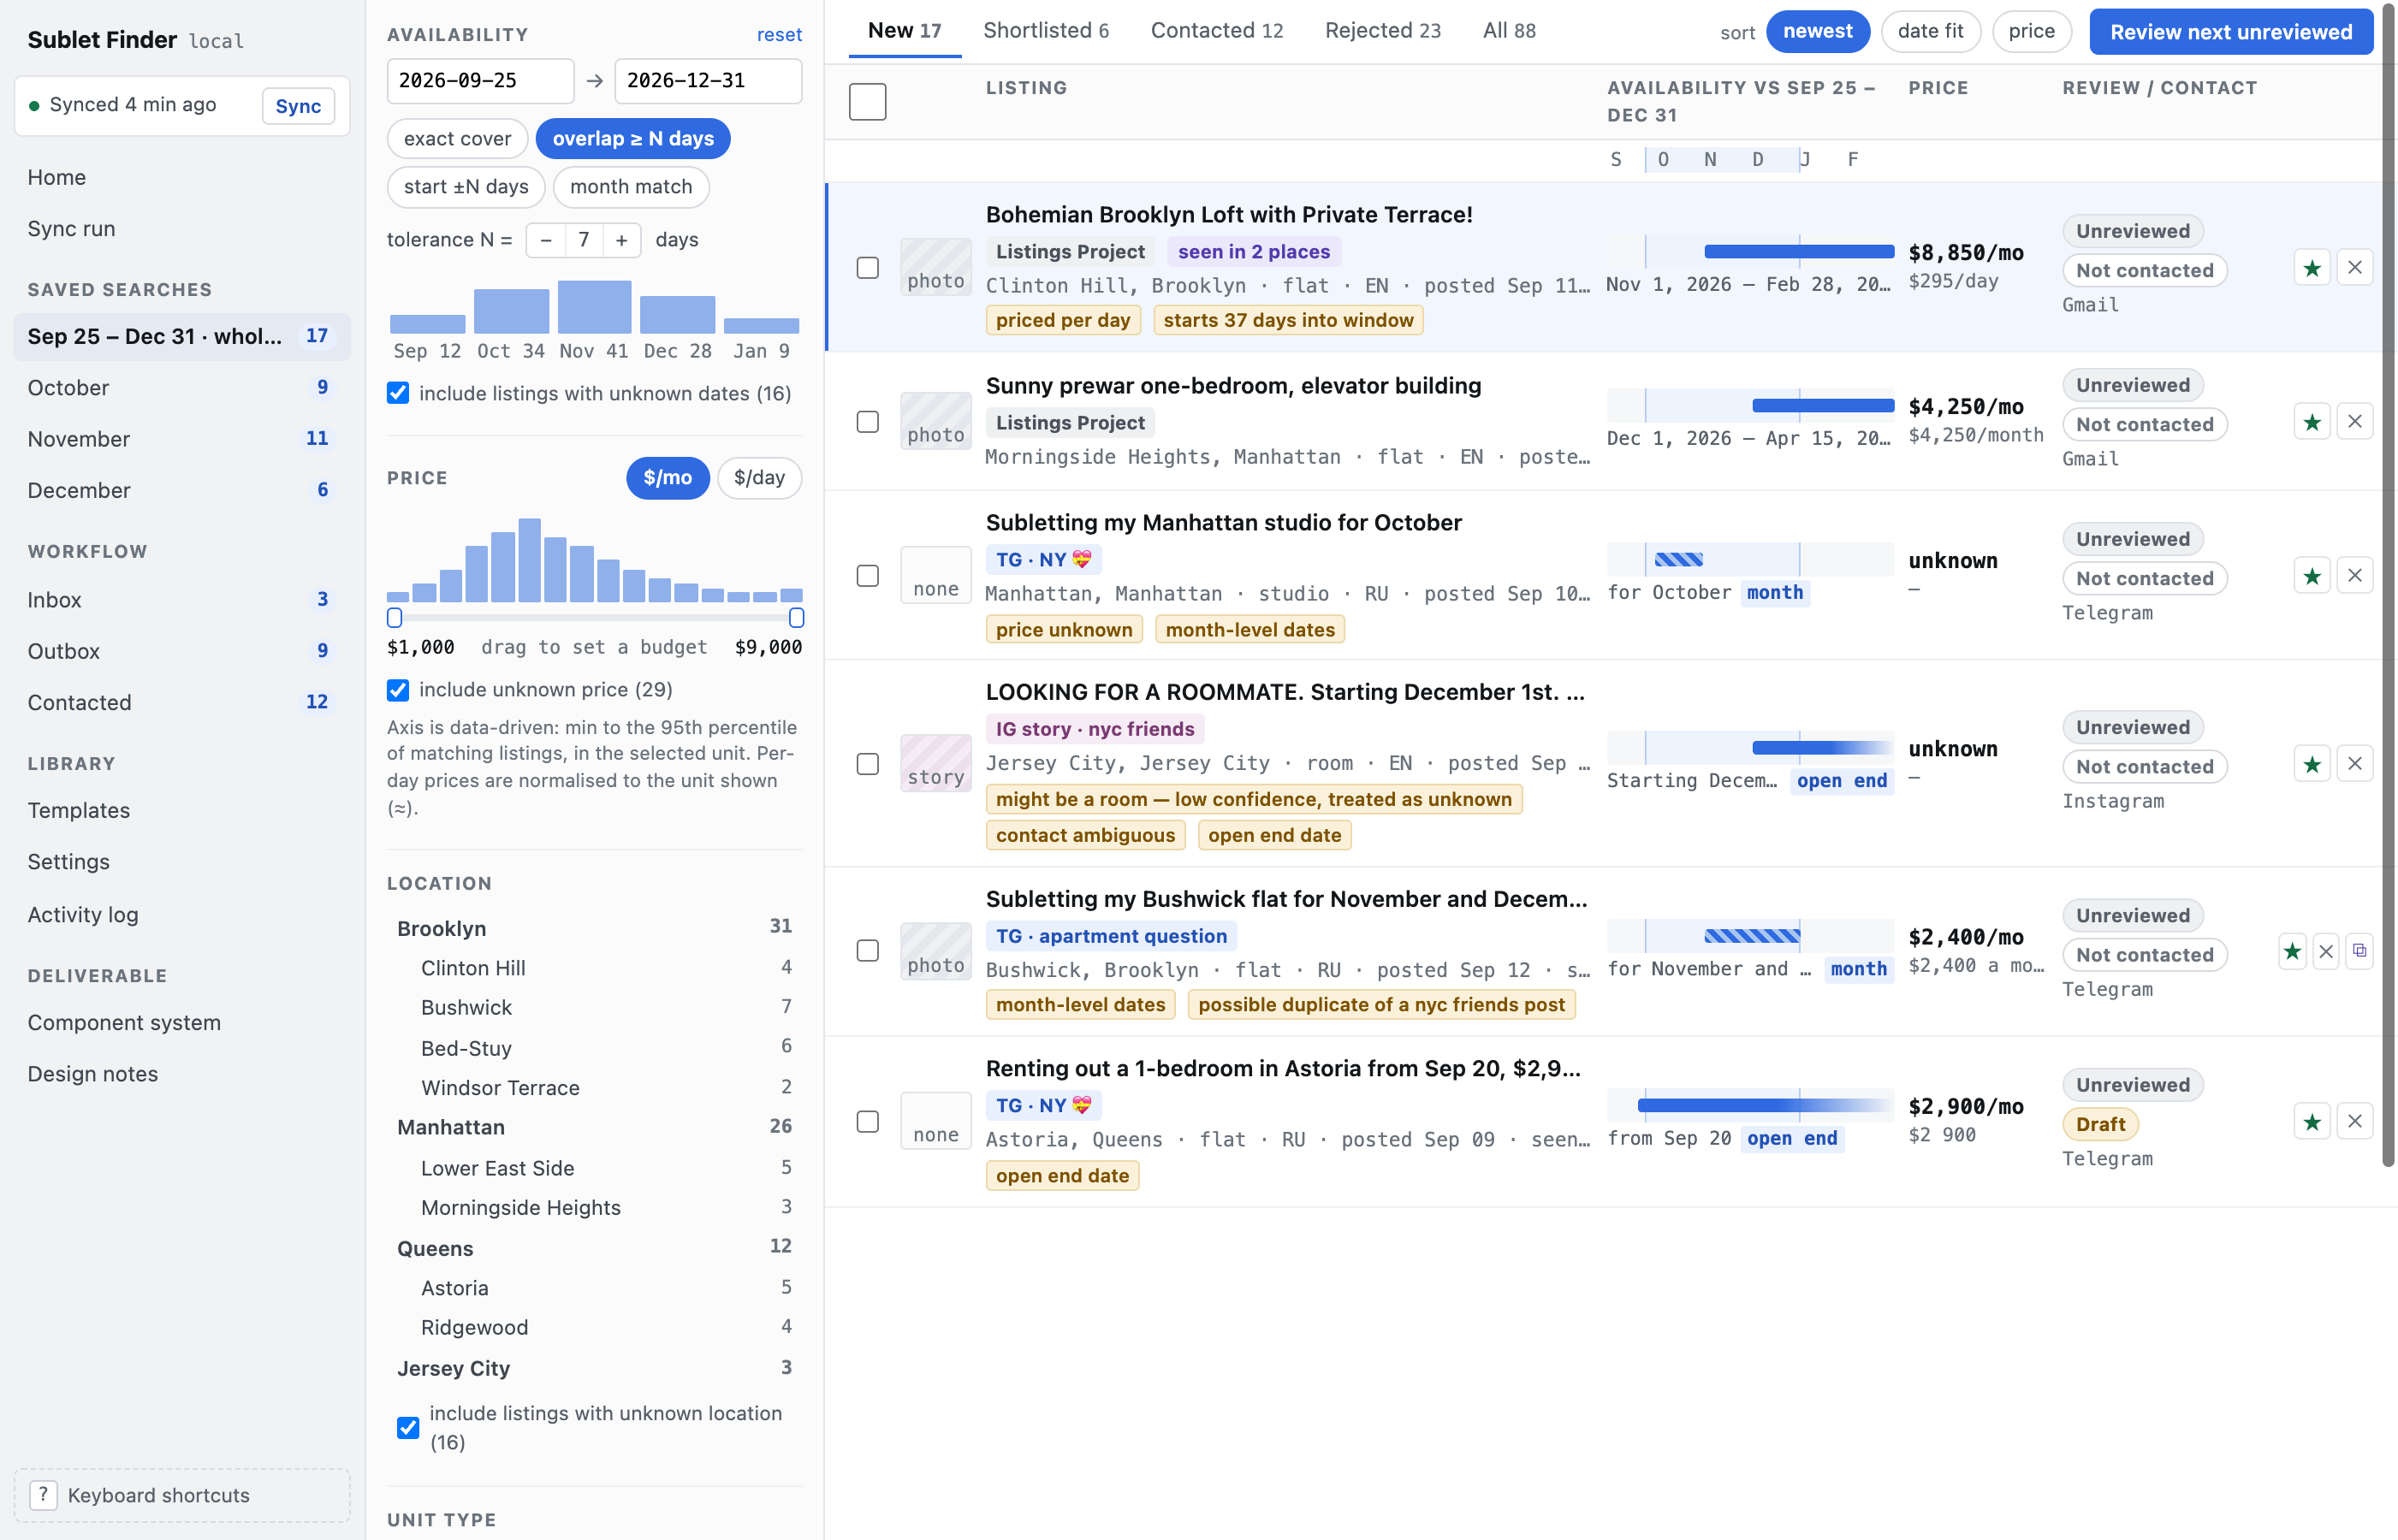
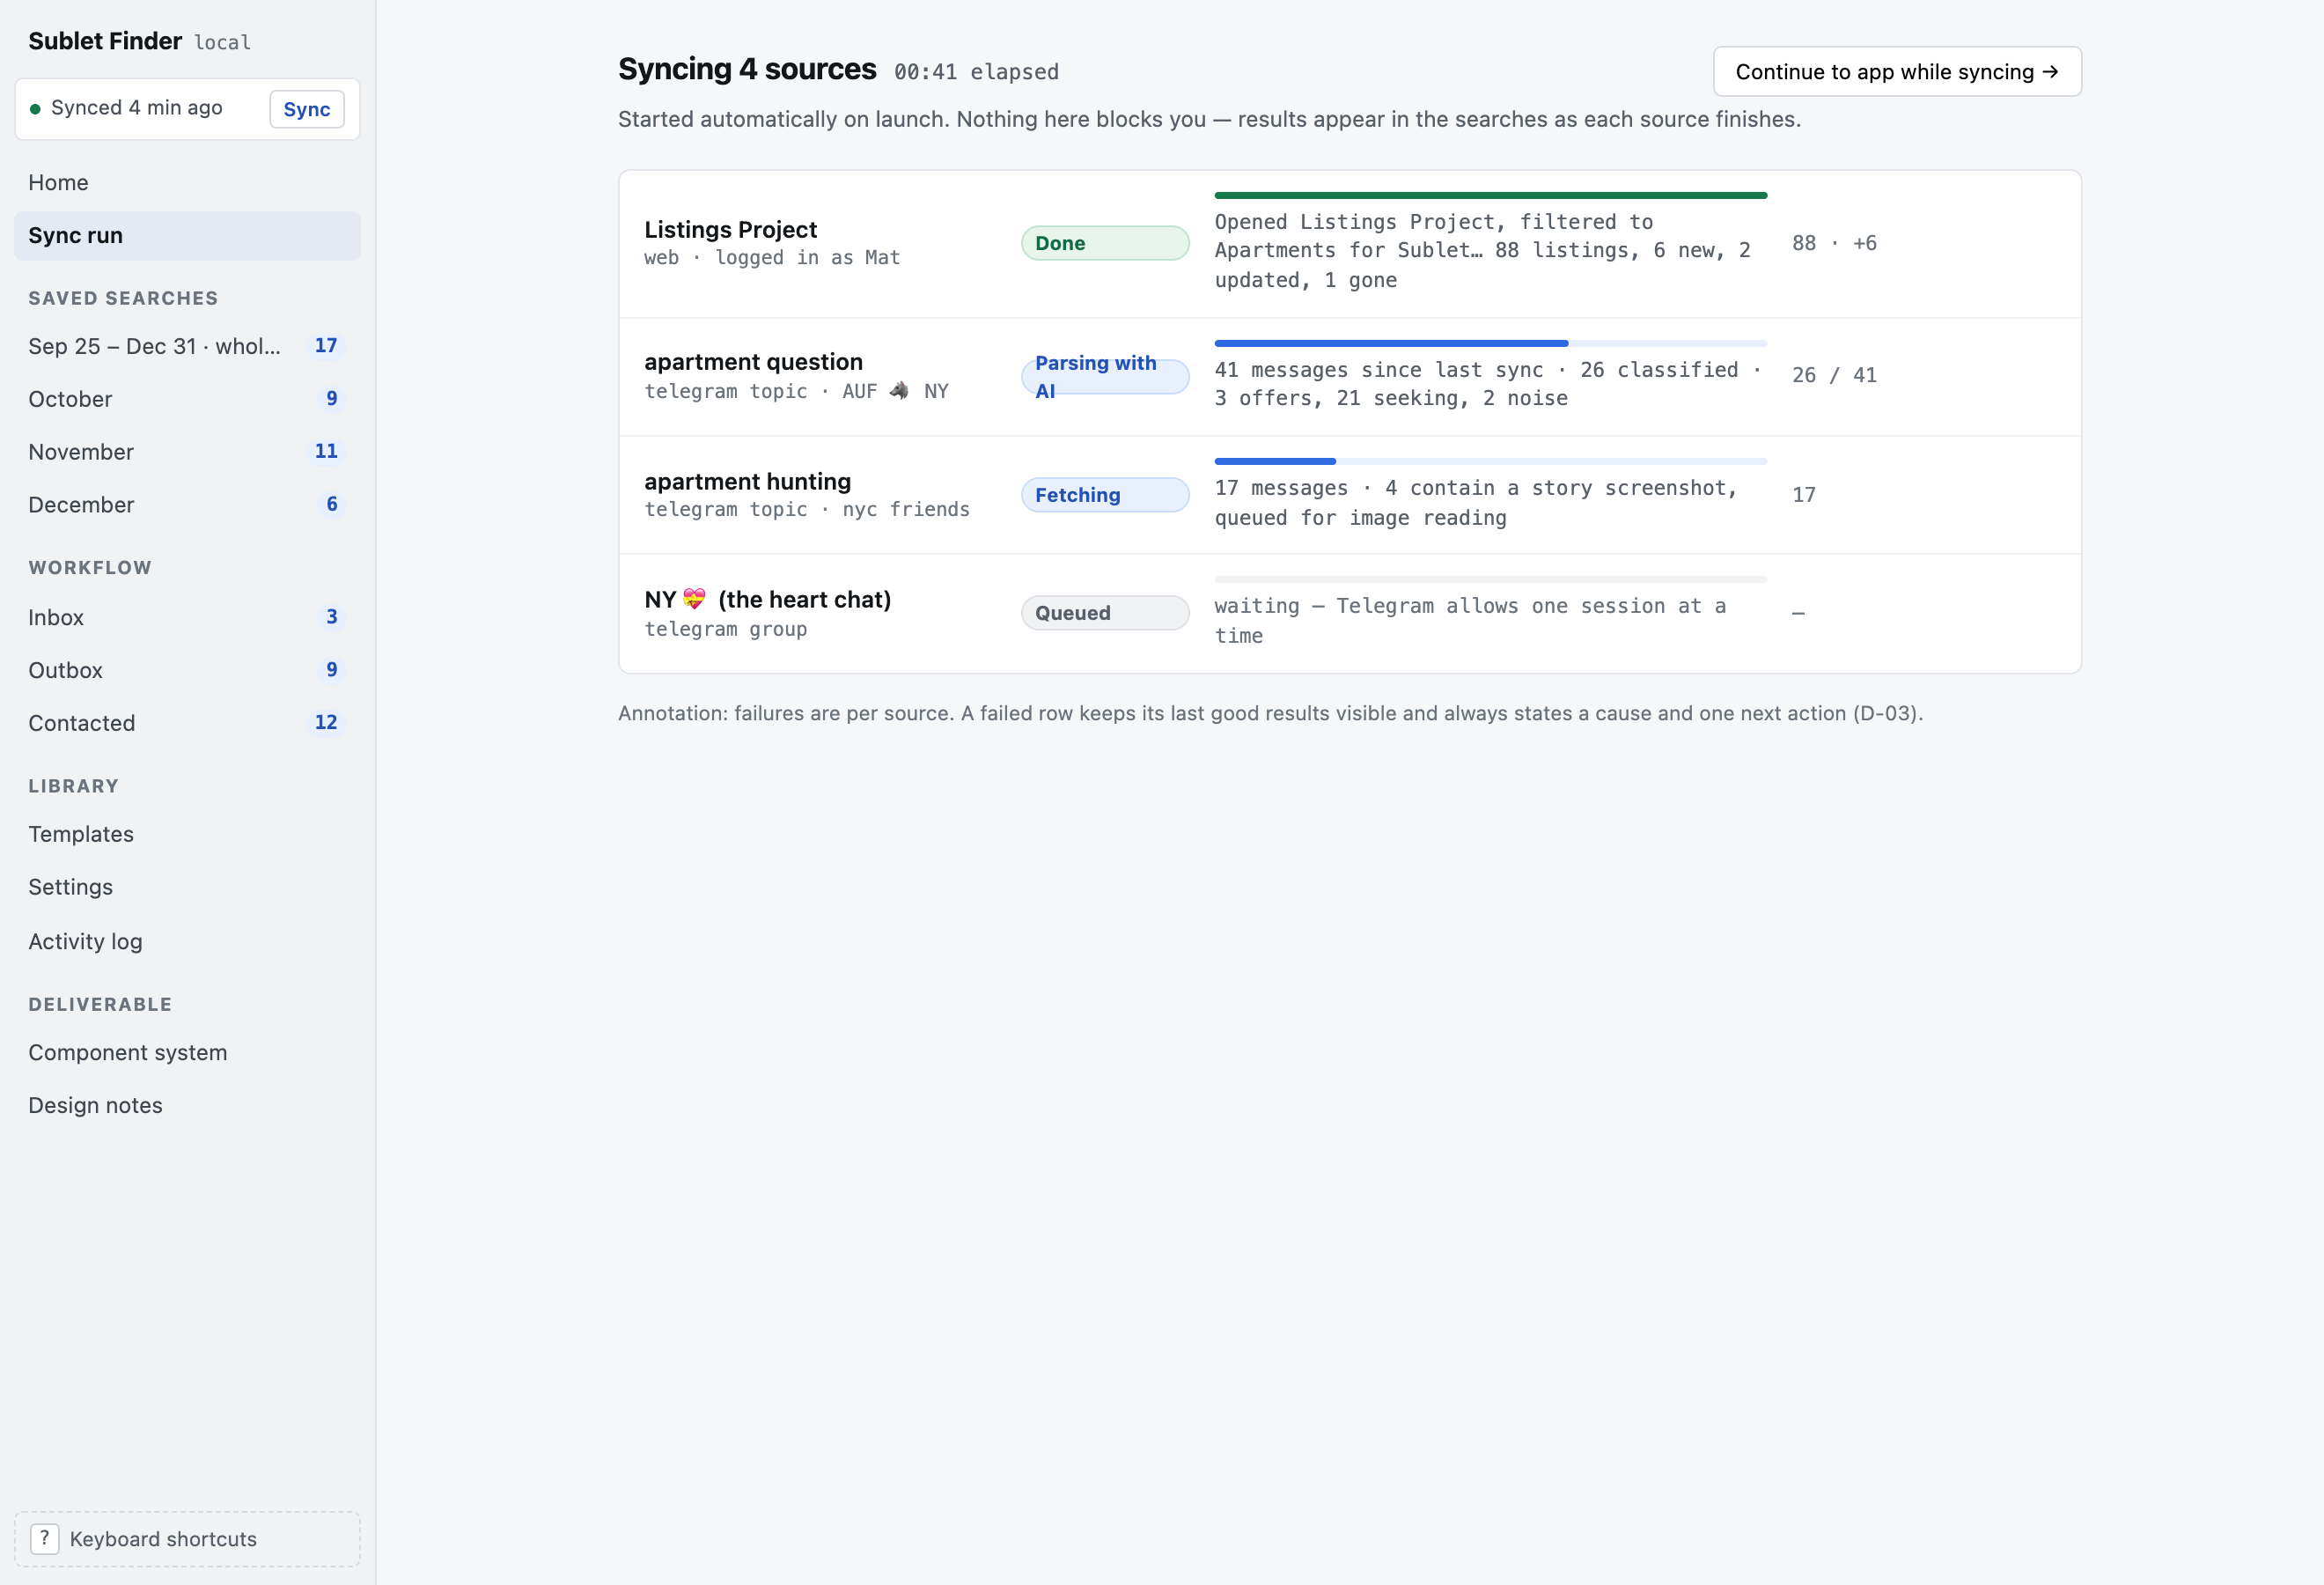
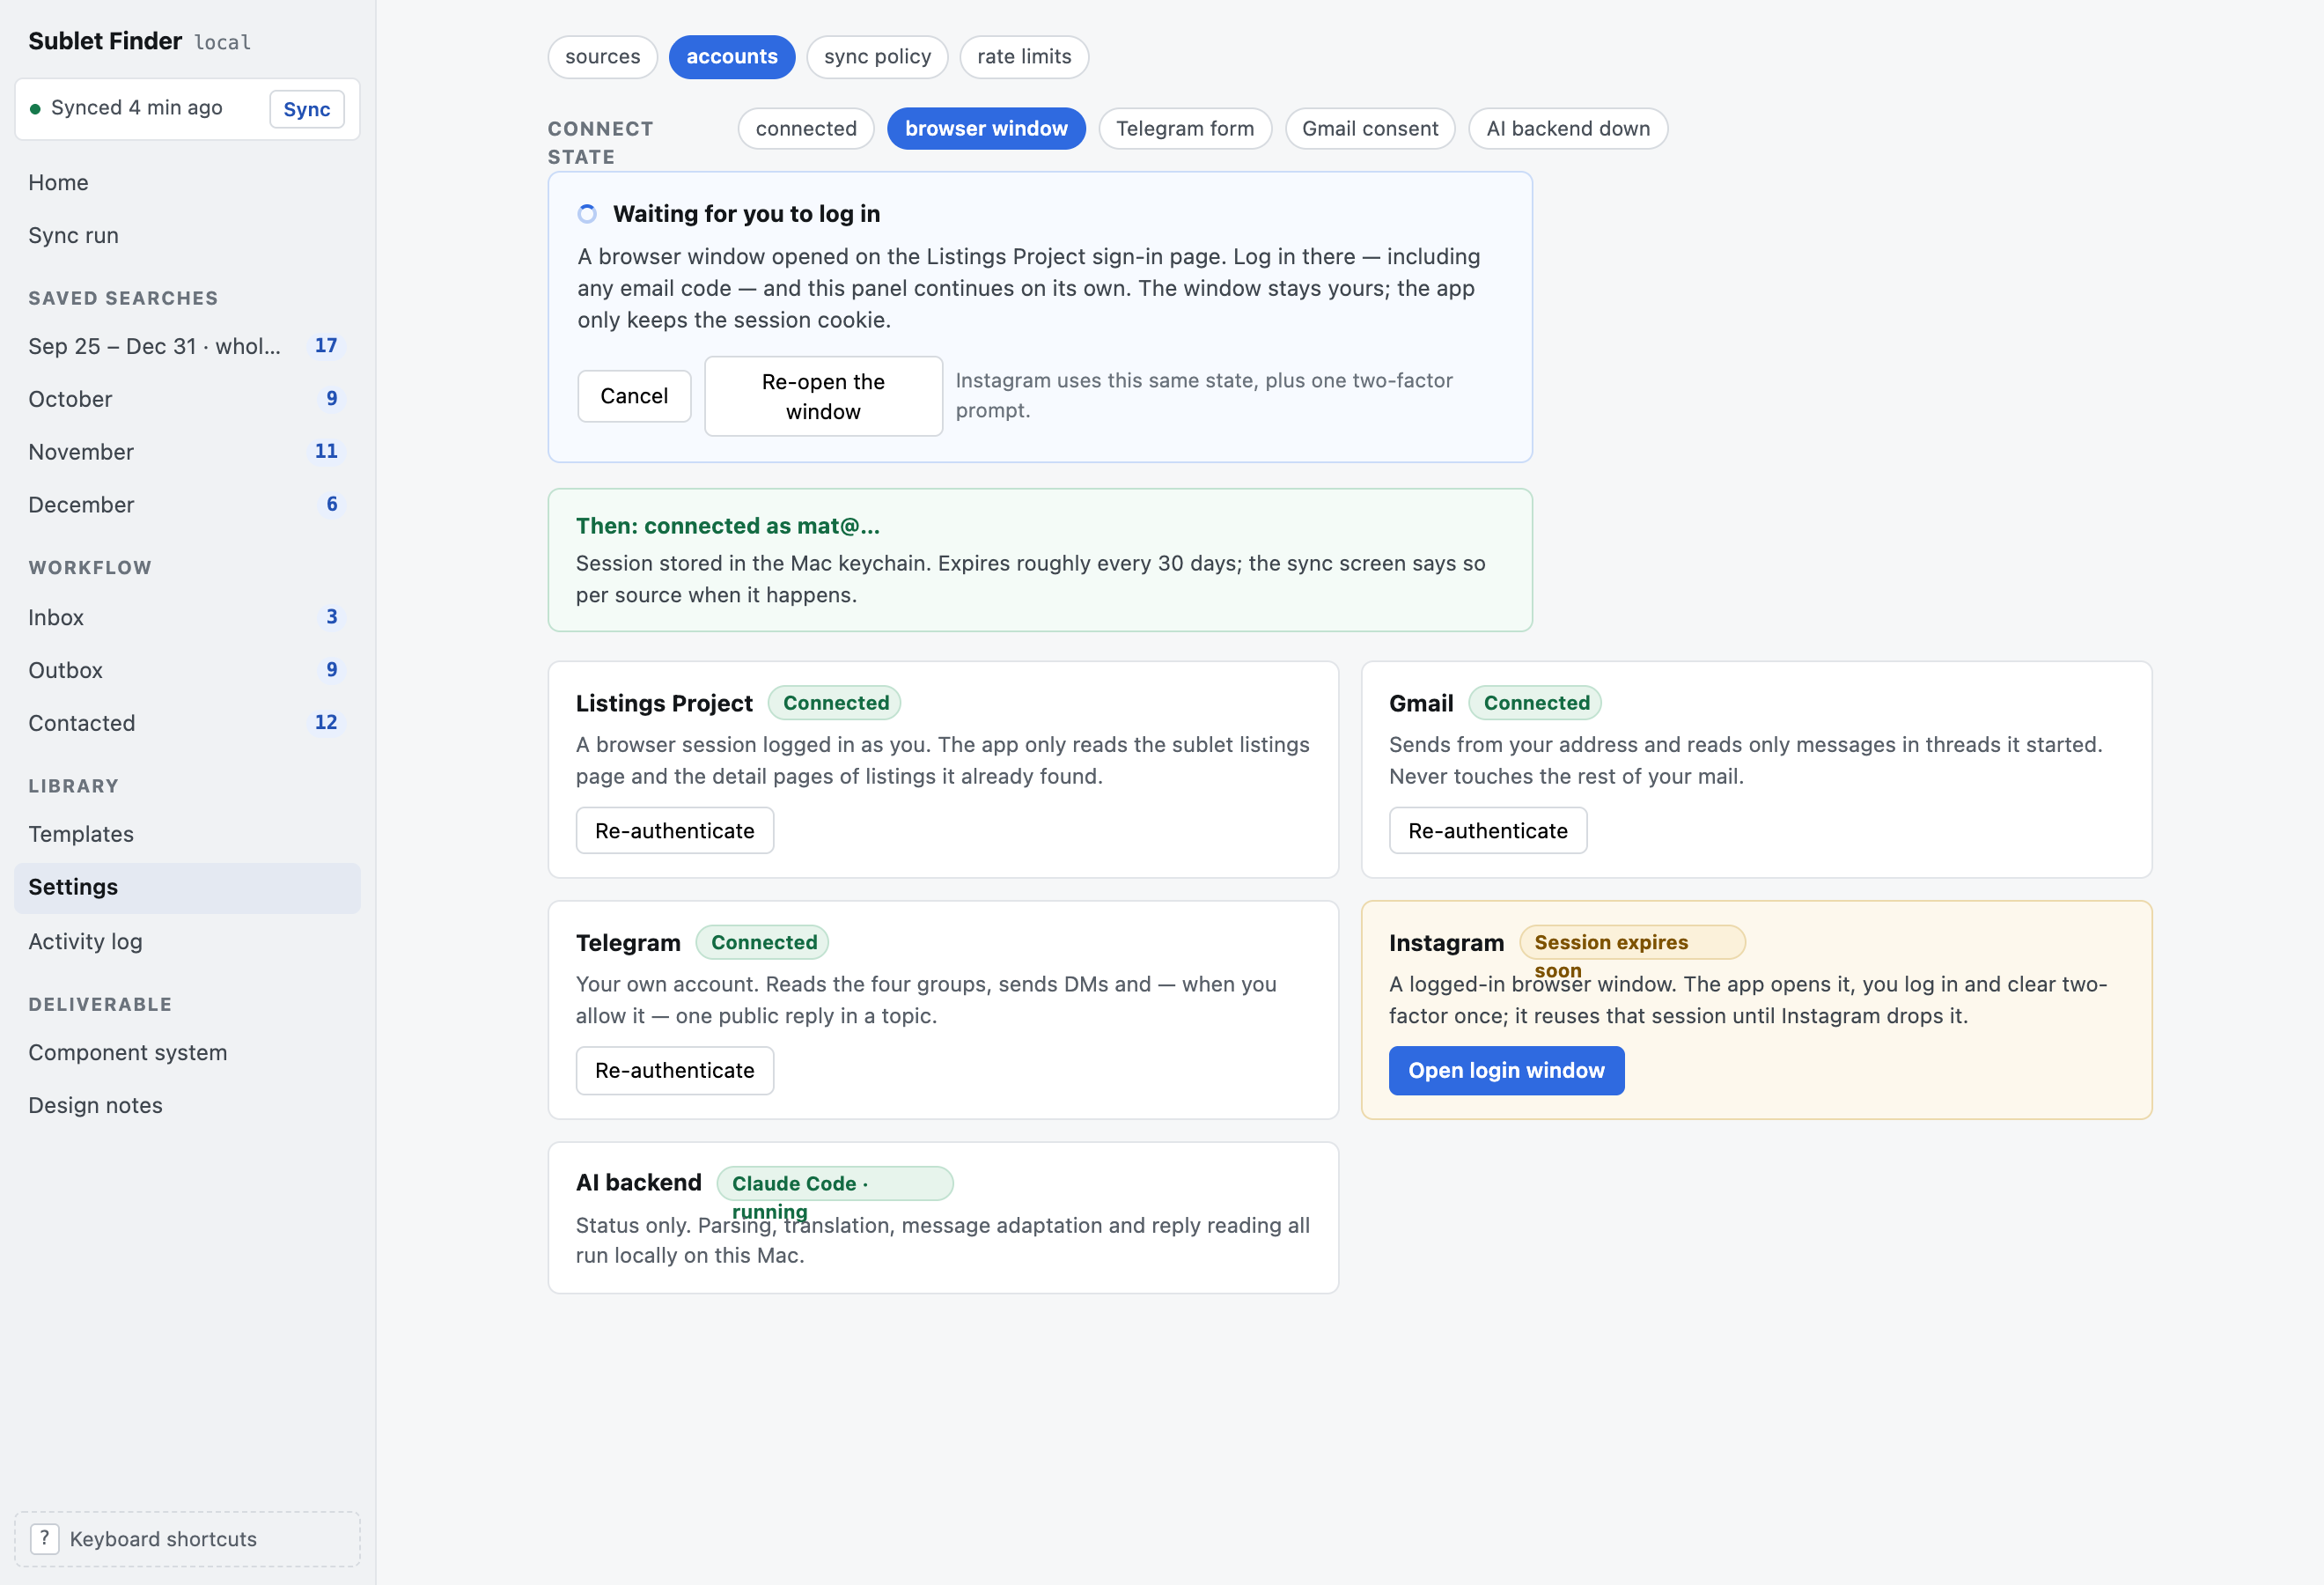
Thankfully most big cities have community-sourced bulletins for mid-term rentals — WhatsApp chats, Telegram channels, Instagram accounts, standalone listings boards. You have to find the ones for your city yourself; two good New York examples are Listings Project and Linked Livin.
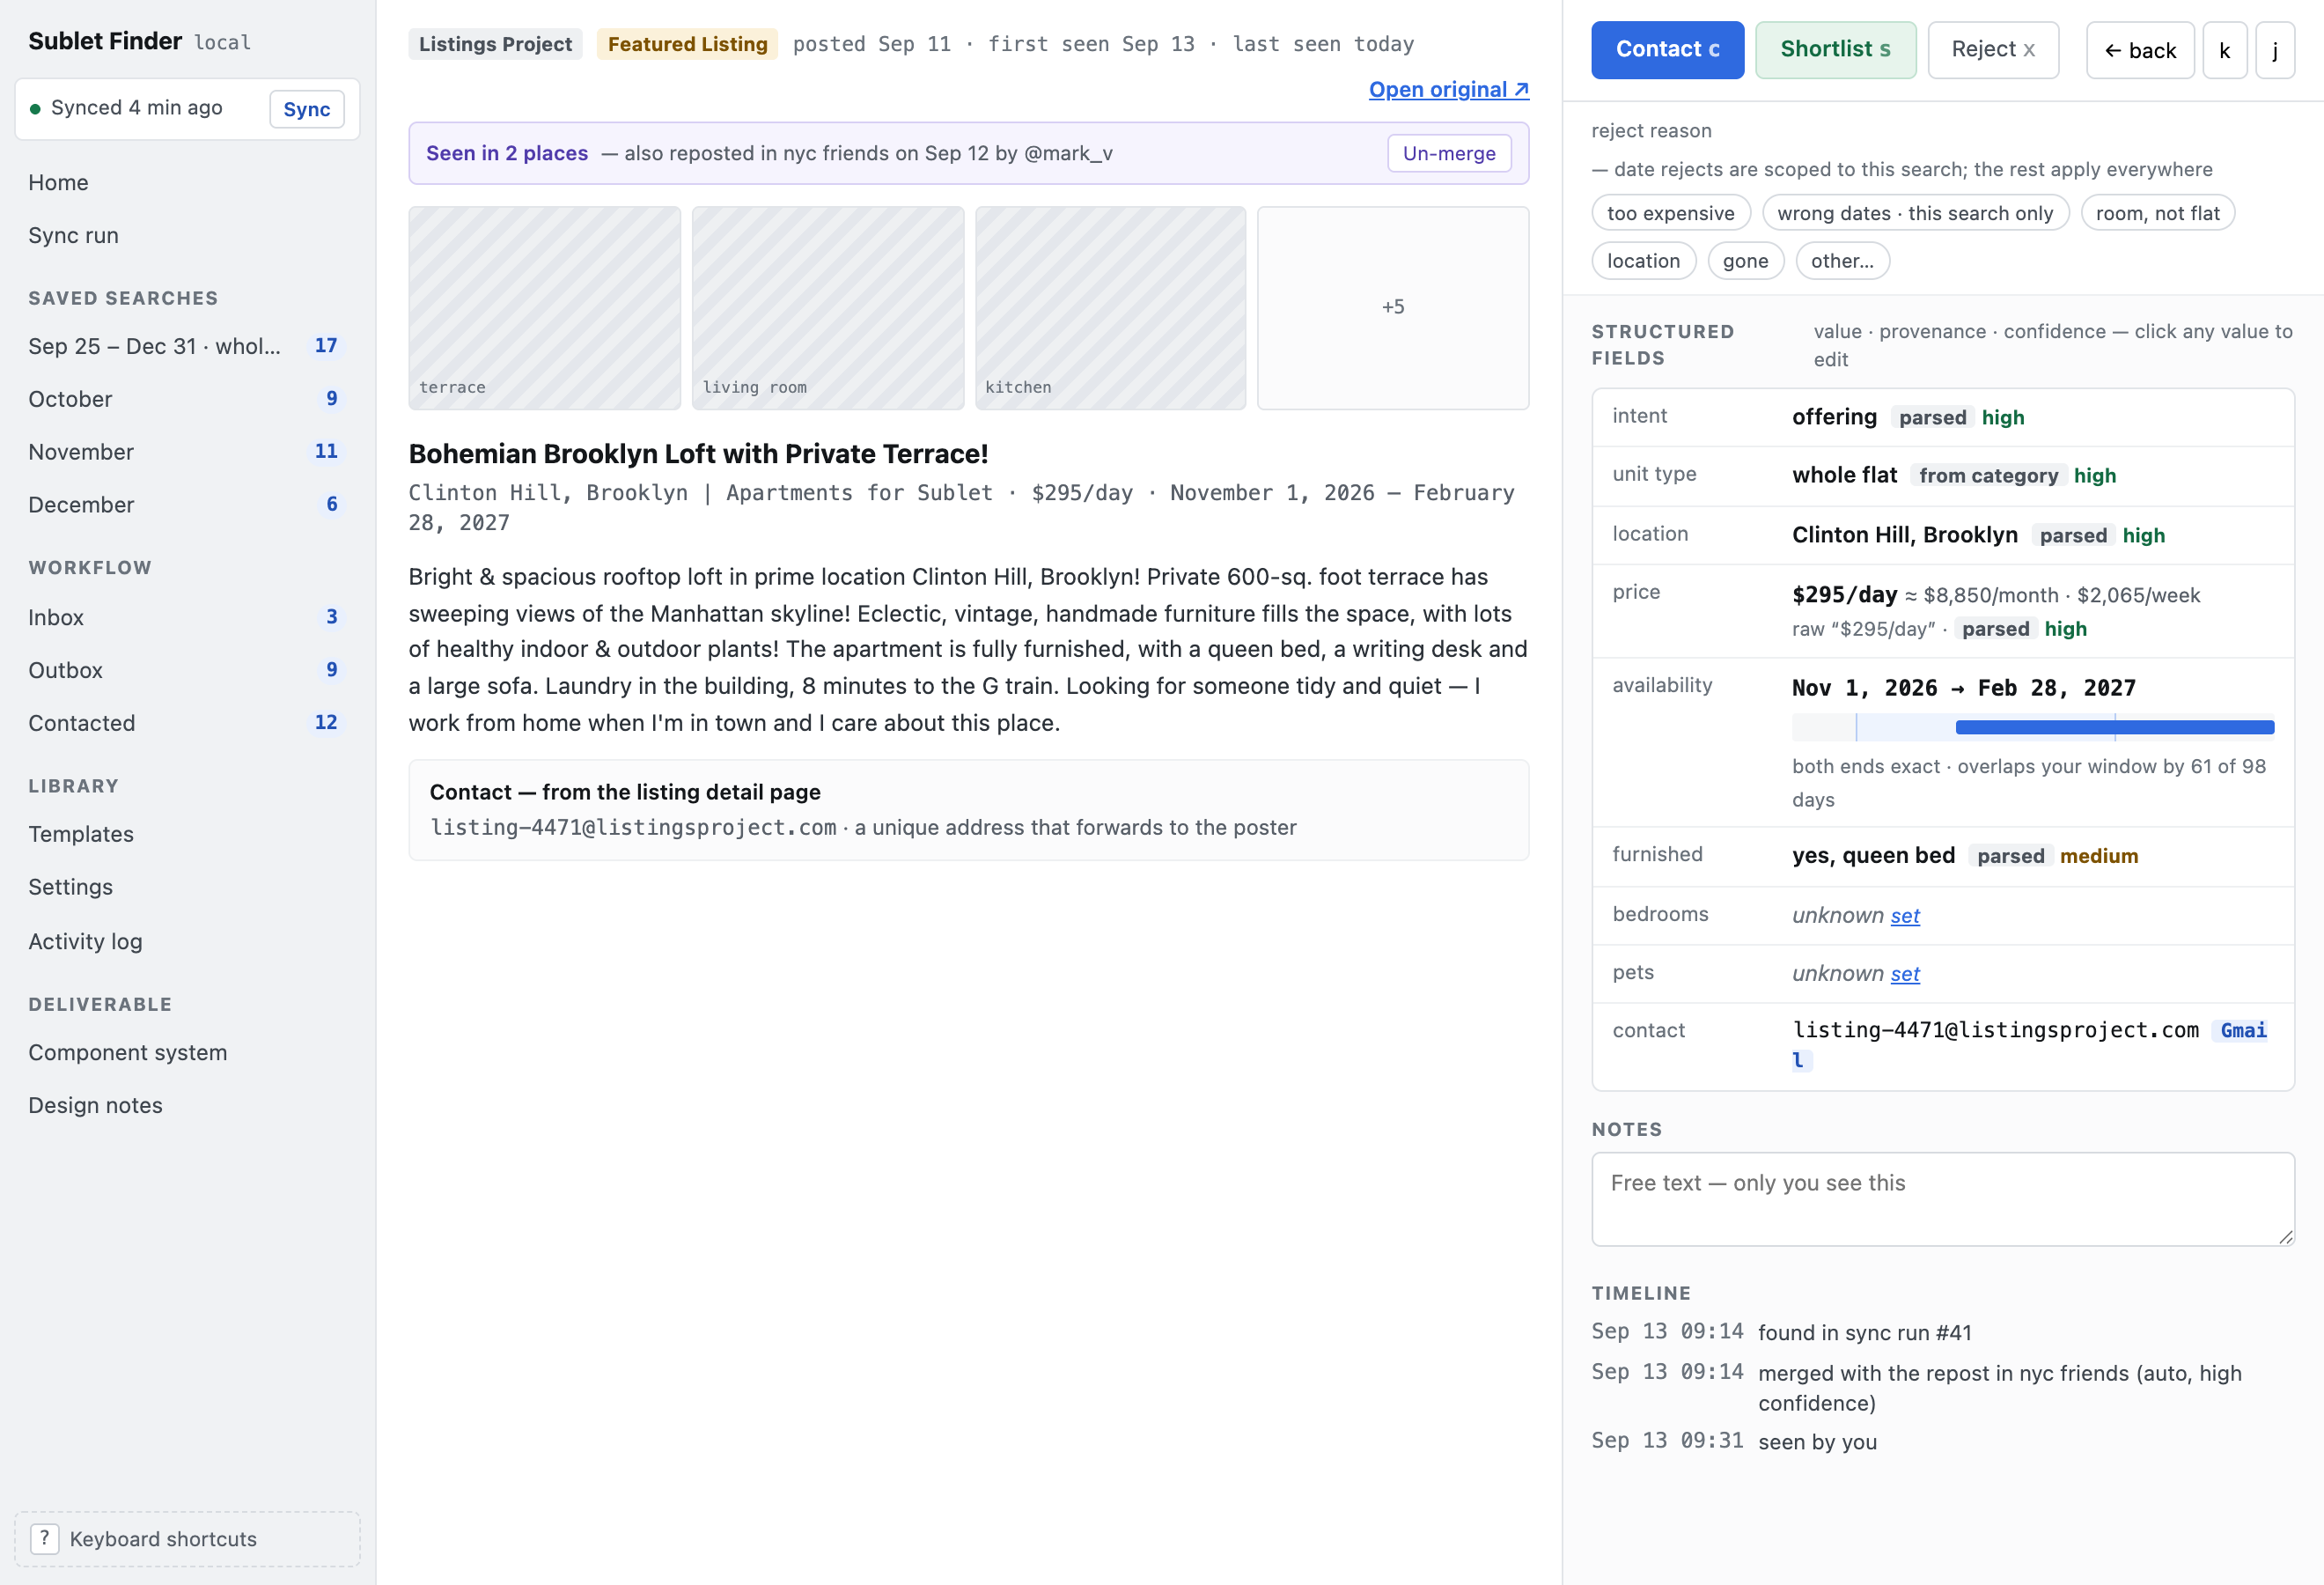
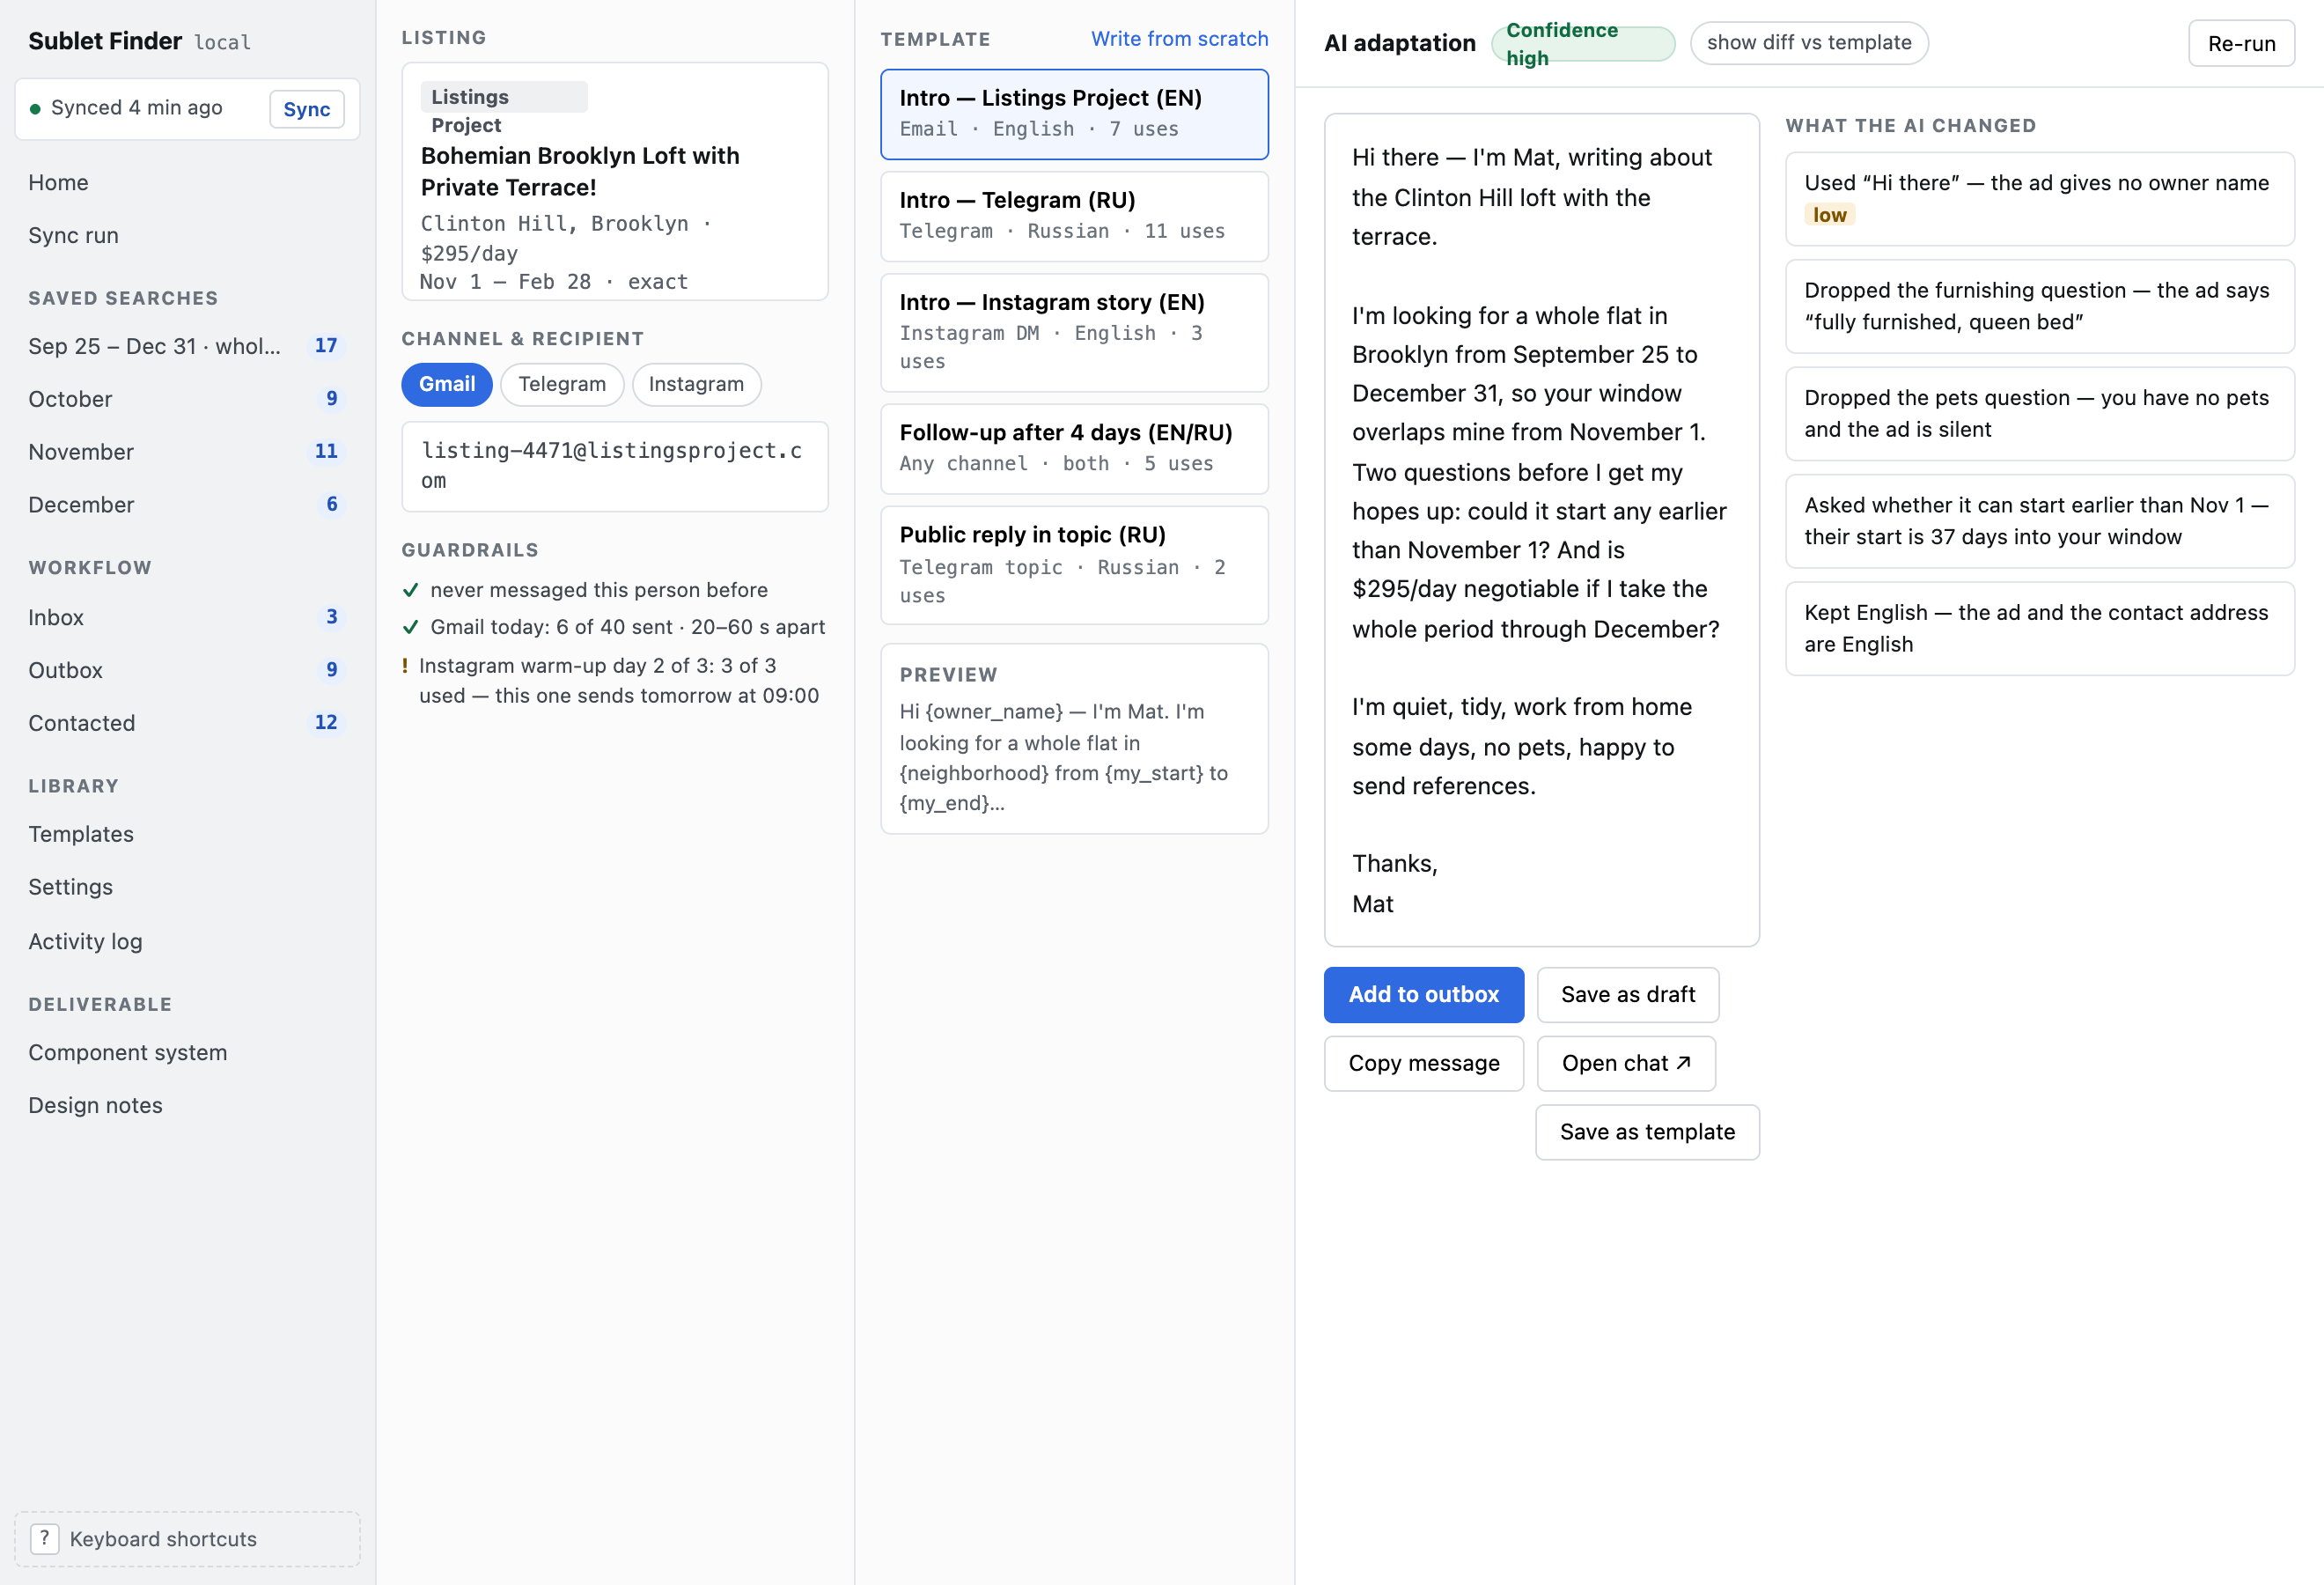
This app parses all of those source types, lets me search and filter the results, and bulk-sends messages from templates — names and dates filled in automatically and checked against the listing.
Over a year of using it I reckon I saved several thousand dollars, and got well-lived-in apartments from people simply covering their rent while away. There are none of Airbnb's protections here — though I've had fewer prickly experiences this way than on the big platforms, which I also use plenty.
Polymarket behavioural bias
I started looking at prediction-market trading on reports of heavy consumer flow and, relative to listed markets, thinner coverage by systematic players. I began by reading most of what has been written on the subject: roughly 60 academic papers, a dozen practitioner posts and a few textbooks and lecture courses on betting markets, distilled into one Polymarket knowledge-base whitepaper.
It catalogues 32 strategies in five families — information edge, microstructure, wallet copying, resolution mechanics, protocol attacks — each scored on capital, infrastructure, crowding and other dimensions. Title page, contents and the matrix are below; the full document is available on request.
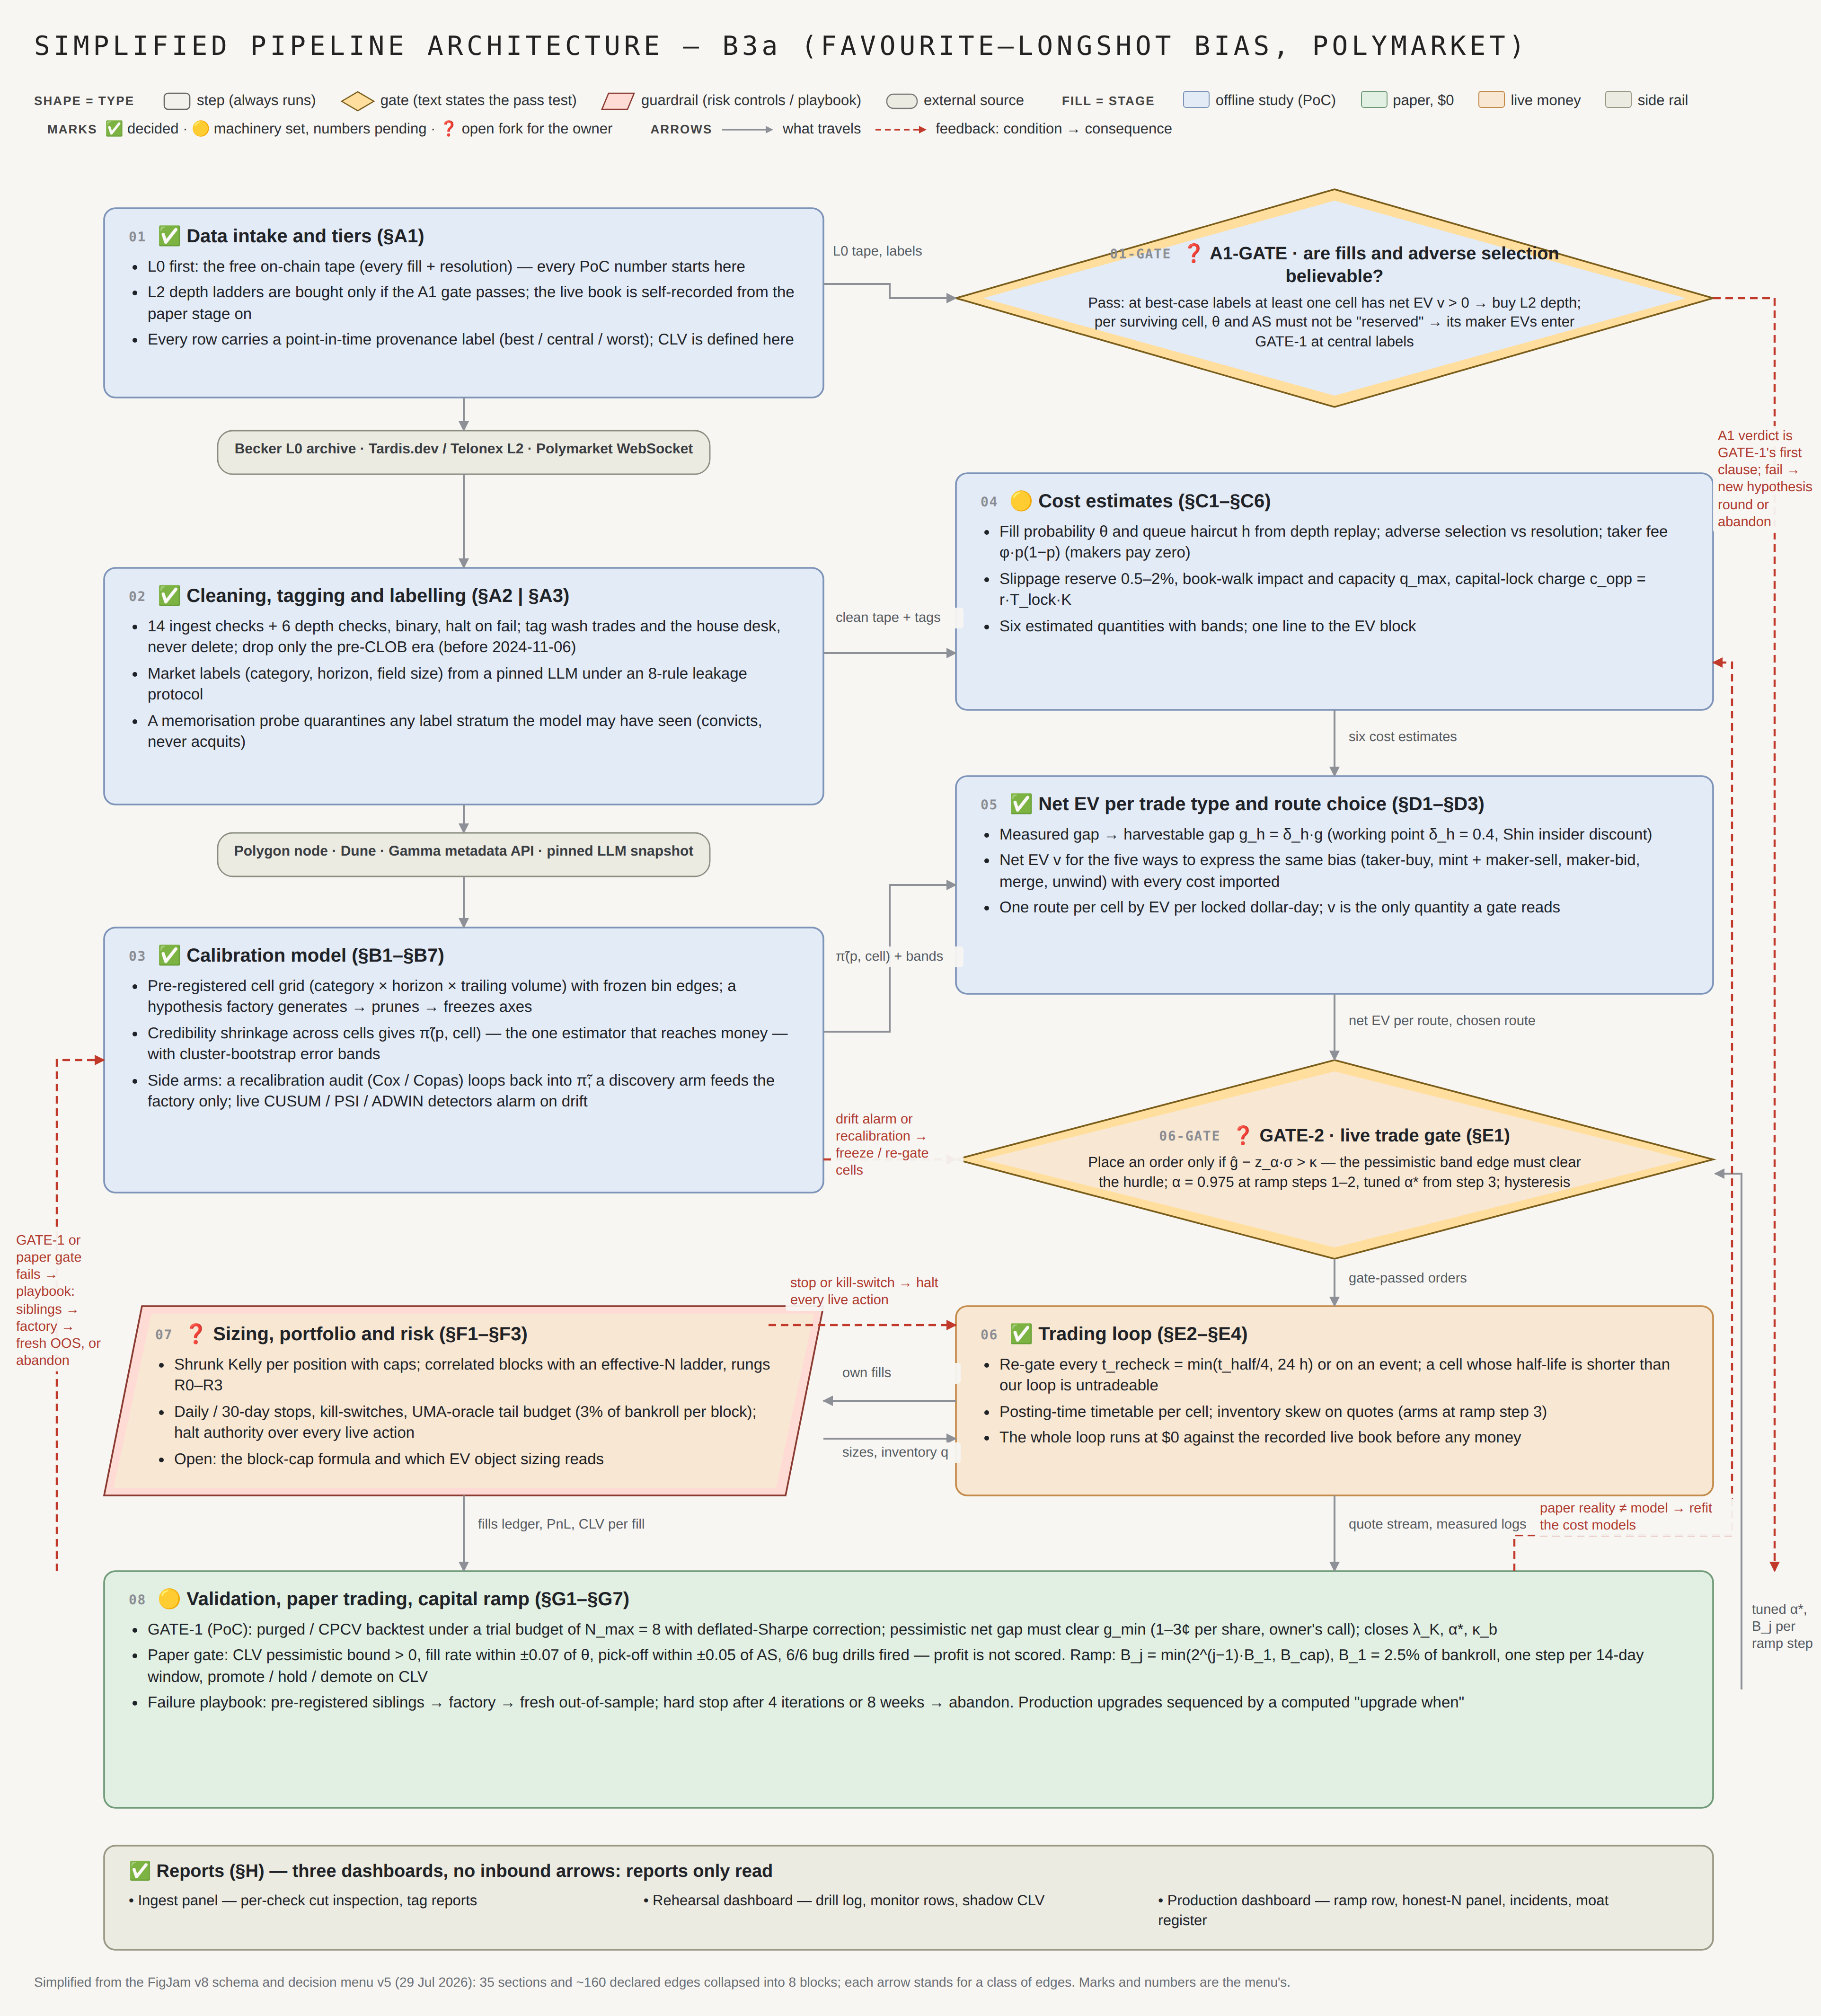
I'm now building a systematic strategy on the behavioural biases. A simplified version of the pipeline architecture for the longshot bias is below: provenance-tagged on-chain data, a gate on fill and adverse-selection assumptions before capital is committed, and a cost model covering taker fee, queue position, slippage and locked capital.
Options 201, examined
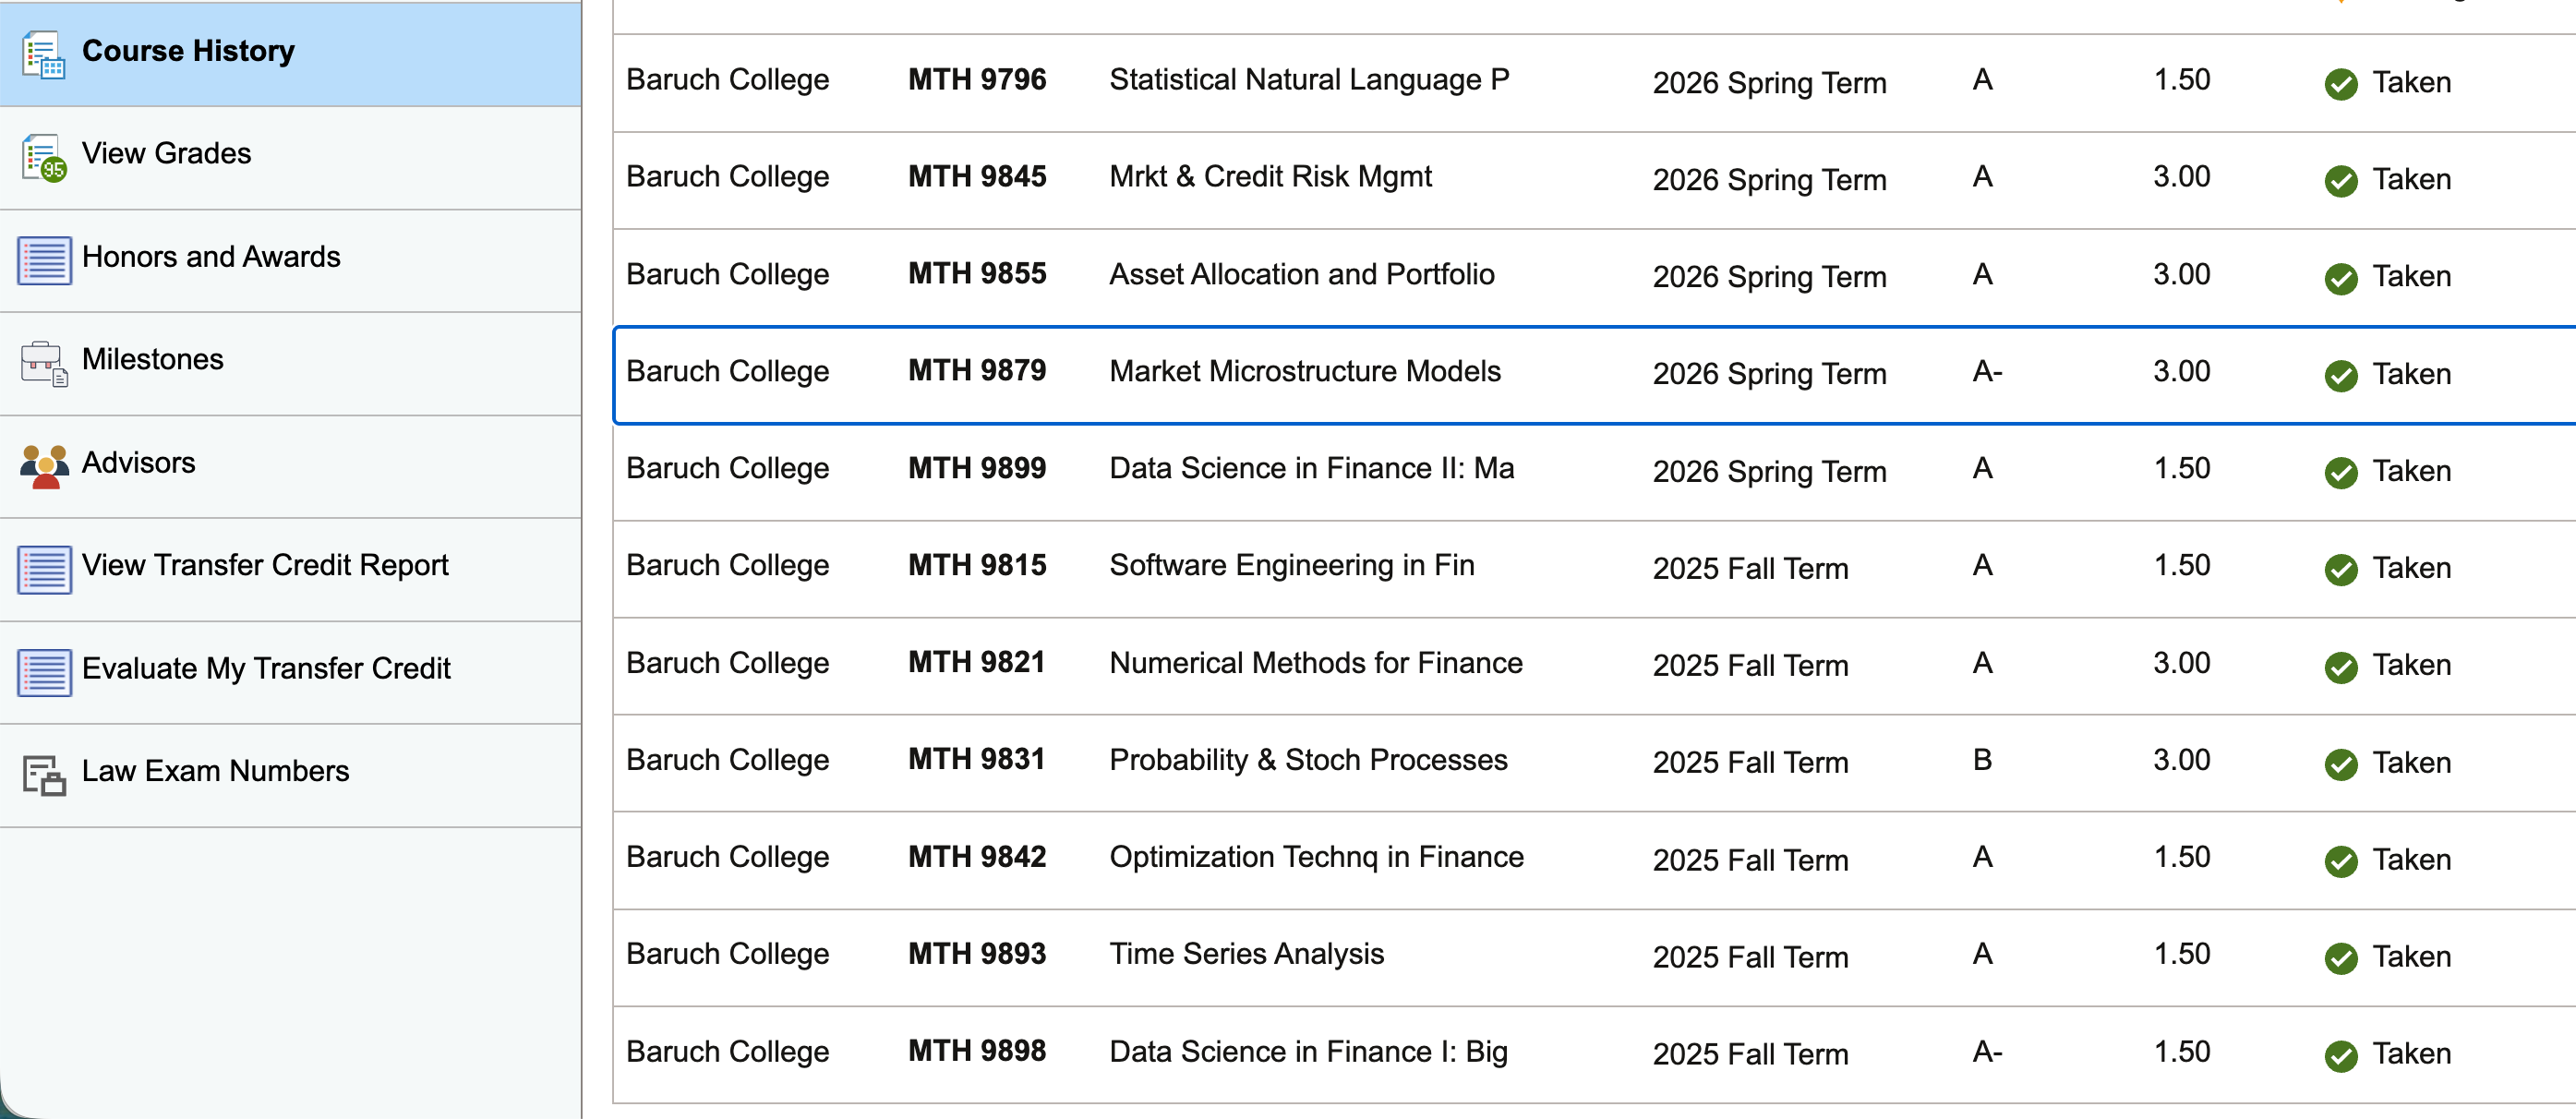
Trader-training course on options pricing and risk, completed with the closing examination.

G-Research puzzle
Preliminary transcript
Recovering imaging on a GPS-denied satellite
Details are confidential, but if you're curious about what to do, when a multimillion dollar satellite loses GPS in orbit - talk to me. Imaging depends on knowing quite exactly where the spacecraft is.
I led the recovery: entropy-based autofocus, external orbital data and curtailed view angles — restoring commercial-grade capacity on a >$20M asset that was facing write-off.
A contract role, taken deliberately as a bridge: it ran up to enrolling full-time in the Baruch graduate maths programme.
Real-time VR for enterprise - miles better than Meta Quest or Vision Pro
Took a real-time HD VR platform 0-to-customers against an Nvidia product with a thousand times the funding, leading 20 engineers.
 Watch on YouTube ↗
Data platform for a 2,000-person eng org
Owned the internal data-tooling platform for a 2,000-person engineering org at a >$5B EV company. The work was integration and measurement: scoping the integrations across a dispersed industrial IT landscape — Siemens Teamcenter (PLM) and NX (CAD) on the engineering side, Odoo (ERP) on the business side — defining the KPIs vehicle-development data was held to, and running the data-quality programme that took the data-quality index up 10x with org-wide adoption.
Severa teams under me: the tooling engineers an ex-consultant process-improvement group.
Patented fuel-efficiency scoring
Correlation and regression models over high-dimensional telematics — speed, RPM, pedal use, auxiliary equipment.
Most of the work was handling heterogeneous, partially missing signals and defining segmentation rules across vehicle classes so the score stayed interpretable.
Ad enforcement as a knapsack problem
Reframed a quality-versus-revenue enforcement decision under do-not-touch account constraints as constrained optimisation, backtested the policy on historical data, and shipped proof-of-concept code for production.


Advanced analytics engagements
Core member of the advanced-analytics practice. Hands-on operations and analytics engagements where I led the client analyst teams and built the models myself, plus the quantitative side of several due diligences. Project examples: